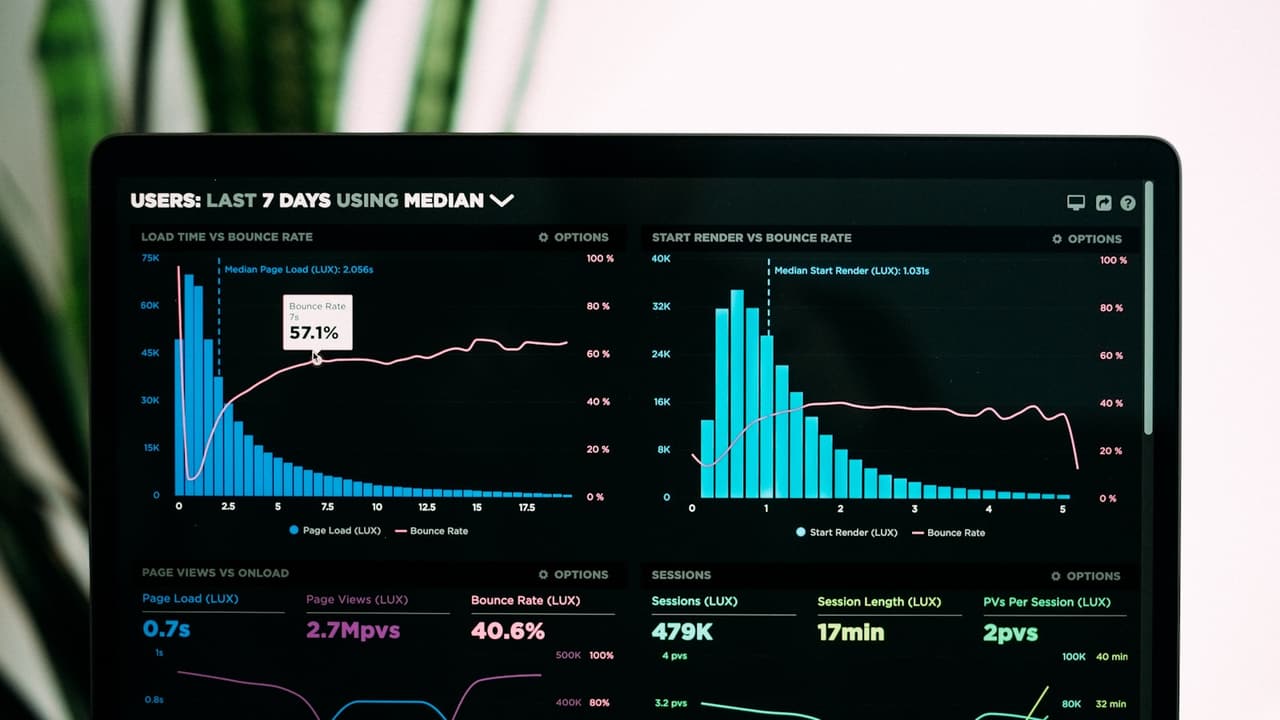
In a market moving as quickly as Saudi Arabia's, executives cannot afford to wait for annual financial statements to understand how the business is really performing. A focused set of financial key performance indicators (KPIs) turns raw accounting data into early signals — showing where margins are eroding, how many months the available cash will last, and whether customers are paying on time. This article outlines the core financial KPIs every executive should track, and how to bring them together in a practical dashboard that supports decision-making.
Why Executives Need a Short List of Financial KPIs
Financial reports contain hundreds of figures, but leadership time and attention are scarce resources. The value of KPIs lies in selection: a handful of measures that connect daily operations to the company's strategic goals. A strong executive set usually answers three fundamental questions — are we genuinely profitable, do we have enough liquidity for near-term obligations, and how efficiently are we turning sales into actual cash?
Tracking too many indicators dilutes focus, while tracking too few hides risk. In most cases, five to eight well-chosen financial indicators, reviewed on a fixed monthly rhythm, are enough to steer the company. Equally important, a single agreed definition for each indicator across departments prevents debates about whose numbers are right and keeps the discussion focused on the decisions themselves.
Profitability Signals: Gross Margin and EBITDA
Gross margin measures what remains of revenue after deducting the direct cost of the goods or services sold, and it reveals whether the core offering is priced and delivered profitably before overheads enter the picture. A persistent decline in this margin often points to rising input costs, competitive discounting pressure, or an unfavorable shift in the product mix. EBITDA — earnings before interest, taxes, depreciation, and amortization — sits deeper in the income statement and measures operating profitability independently of financing structure and non-cash items, which is why investors and financiers frequently use it to compare companies.
- Track gross margin by product line or business unit, not only at the aggregate level.
- Read EBITDA as a trend across consecutive quarters rather than as a single standalone number.
- Remember that EBITDA is not cash flow — capital expenditure and working capital movements sit outside it.
Liquidity and Survival: Burn Rate and Current Ratio
Burn rate measures the pace at which a company consumes cash each month, and it is the defining indicator for startups and for any business that invests ahead of mature revenue. Dividing available cash by the monthly net burn gives the cash runway: the number of months the company can keep operating before it needs new funding or positive cash flow.
The current ratio completes the picture by comparing current assets to current liabilities. A ratio well below one may signal difficulty meeting near-term obligations, while an unusually high ratio can indicate idle cash or slow-moving inventory. Healthy ranges differ by sector, so the trend over time matters more than any single number.
- Recalculate the cash runway monthly, and update assumptions whenever hiring or expansion plans change.
- Watch the components behind the current ratio — rising inventory can flatter the ratio without improving real liquidity.
Collection Discipline: Days Sales Outstanding (DSO)
Days sales outstanding (DSO) measures the average number of days between issuing an invoice and collecting the cash. When companies chase growth with generous credit terms, DSO tends to rise — and profit that looks solid on paper remains locked in customers' hands. Because business-to-business payment cycles can stretch, reviewing DSO monthly and pairing it with clear credit policies is one of the most direct ways to protect liquidity. A practical approach is to segment DSO by customer category and define escalation steps that are triggered automatically as invoices age.
From Spreadsheets to Dashboards: Making KPIs Usable
Indicators create value only when they are timely, consistently defined, and visible to the people empowered to act on them. A dashboard — even a simple one — brings the KPIs together with their trends and targets, refreshed on a fixed schedule. Three habits make dashboards effective: define each KPI once (formula, data source, and owner), automate the data feed from the accounting system wherever possible, and review the dashboard in a standing monthly leadership meeting where decisions are recorded. In Saudi Arabia, the shift toward digital financial infrastructure — including the e-invoicing phases introduced by the Zakat, Tax and Customs Authority (ZATCA) — is steadily improving the quality of the data that feeds these dashboards.
Conclusion
The right financial KPIs give leadership a shared, fact-based language for steering the company: gross margin and EBITDA for profitability, burn rate and the current ratio for liquidity, and DSO for cash-collection discipline — all made actionable through a well-designed dashboard. Building this capability does not require a large finance department; it requires clear definitions, reliable data, and a consistent review rhythm. If you would like advisory support in designing your company's financial KPIs or building an executive dashboard, the Makeen Business Solutions team would be glad to hear from you. This content is general educational material and does not constitute binding professional advice; for regulated matters, please consult the competent licensed entities.